Turn a Diablo Super Biker GPX export, or a RaceBox CSV export, into a map, synchronized telemetry, lap or mountain-run comparisons, and a local history of your progress.
Drop your lap-timer file into the page and the session opens on Summary: what happened, where it happened, and what to try next. That one screen is enough to walk away with something for your next stint.
Everything after it is optional depth. Analyze is one session in detail, Compare puts two laps side by side, Coaching collects what the recording actually supports, and Progress keeps your history on this device.
If you read only one section of this guide, read Quick start. The rest is here for when you want it — and for what each number means, see the KPI reference.
Quick start
1
Load a ride Drop a Diablo Super Biker .gpx file or a RaceBox .csv export anywhere in the window, use the Load session button in the always-visible top bar beside the Trackday Analyst chicane mark to browse or pick a bundled sample, or choose a sample card from the welcome screen. Personal files are processed in this browser and never uploaded. (RaceBox's other export formats — VBO, KML, its own GPX — are not supported; always use the CSV.)
2
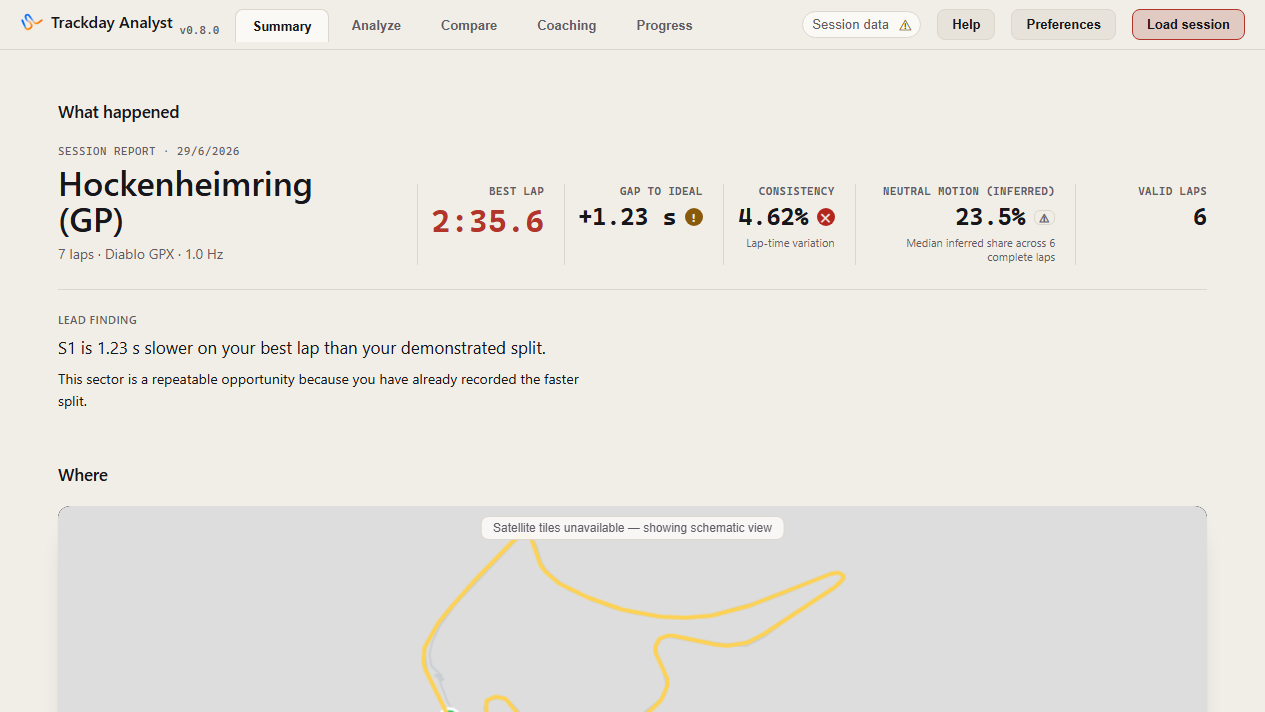
Start with the session report Each loaded session opens on Summary: circuit identity, five key figures, map, lap ladder, and focused coaching. The cover visibly names Good, Watch, Off target and No verdict, so the marker vocabulary no longer depends on hover. Directed figures remain judged against a rider-set target; best lap and valid laps remain unrated. Every cover figure has a focusable ? link to its exact KPI Reference entry, and Neutral motion (inferred) explains that it estimates near-zero derived longitudinal acceleration from GPS and lean rather than throttle or brake sensors. Use Analyze for one session, Compare for two laps or runs, Coaching for what the session shows about your riding, and Progress for history. The quality indicator opens Session data. When the lead finding is a corner, Summary highlights that exact corner, gives the first evidence-backed difference and next-session action, and offers Understand this finding for Coaching or Inspect telemetry to open Analyze on the reference lap with Corners active and the cursor already there.
★
Set your preferences First visits open in the light theme. Use Preferences in the top bar to switch between Dark and Light, choose the Compare delta-map default, or inspect the raw-accelerometer override; your choices are remembered between visits.
3
Follow the shared cursor Move the time slider or interact with a telemetry strip. The map marker, graphs, time readout, and inspector stay synchronized.
Summary, the screen every session opens on: what happened, where it happened, and what to do next.
Before you load anything, the top bar offers only Summary and Progress — the workspaces that can actually show you something. Analyze, Compare and Coaching appear as soon as a file parses.
Closing a session
With a session open, the Load session panel also offers Close session. It closes the file and returns you to the welcome screen, clearing the session, its selected lap or run, comparison choices, cursor and playback state. Your saved Progress records, stored notes, preferences, theme and backups are kept — closing is not deleting, so it asks no confirmation.
Moving between workspaces
Opening a workspace from a button inside the page — Compare laps on Summary, for instance — takes you to the top of that workspace, with its heading, headline figure and map in view. Choosing a workspace you have already visited from the top bar returns you to the spot you left it at. These positions last only for the open session and are never written to your device. If your system asks for reduced motion, the app jumps straight there instead of animating.
Without a mouse, or without sight
The whole entry journey is keyboard-reachable. Time and distance sliders are ordinary range controls (arrows, Page Up/Down, Home, End) and announce the coordinate, lap and sector rather than a bare number. Gains and losses are stated in words and signs, so nothing essential depends on telling red from green. The canvas charts each carry a text readout beside them with the current position and values, and the N-lap overlay has its own keyboard distance control.
Analyze one session
Circuit sessions with at least two complete laps include one Coaching section. Its leading recommendation is open, while supporting advice, consistency figures, and source evidence are available on demand.
In Analysis mode, Coaching profiles show ranked demonstrated sector opportunities, their KPI values and best-lap reference, consistency figures, and data-confidence context. Unavailable analysis is stated explicitly; the profiles do not claim unrecorded rider inputs.
What is different about this corner
Summary and Coaching now locate the same lead corner on a compact map. Summary keeps only the first-level explanation; Understand this finding opens the fuller Coaching evidence, while Inspect telemetry opens Analyze on the reference lap with Corners active and the cursor already inside that corner.
When a session localizes repeatable time loss to one corner, that finding opens into what measurably differs there against your own best lap: where speed starts falling on the approach, how fast you are at the slowest point, your speed entering and leaving, how long the corner is spent with no speed change the recording can resolve, and how far your path sits from the path your best lap took. Each line carries its magnitude, a ± uncertainty, and the source channel it came from.
It does not say you braked too hard, used the wrong gear, or should have opened the throttle earlier — your device records none of those. It does not compare you to an ideal line; there is no such thing here, and every path comparison is against a lap you rode yourself. When several differences show up at one corner it lists them side by side and says outright that the recording cannot rank one of them as the cause.
A difference that cannot be told apart from measurement noise keeps its number and loses its sentence; those sit behind What could not be shown with the reason each was withheld. On a typical session most of the five are quiet, and the ones that speak are the ones the data supports. They need a recording at 20 Hz or better; below that — which includes every standard ~1 Hz Diablo export — all five are unavailable, and Coaching names each one with the frequency it would have needed rather than leaving a blank.
On recognized circuits, white transverse lines mark S2 and S3, and the finish line carries a permanent S1 label — all three sector labels (blue boxes) show in every view, whether or not a lap is selected. Numbered corner-apex markers (violet circles, shown when you turn on Corners) are a deliberately different colour and shape from the sector labels, so turns and timing gates are never confused. At desktop widths, Focus map gives the map the wide column and remembers the choice across Analyze and Compare.
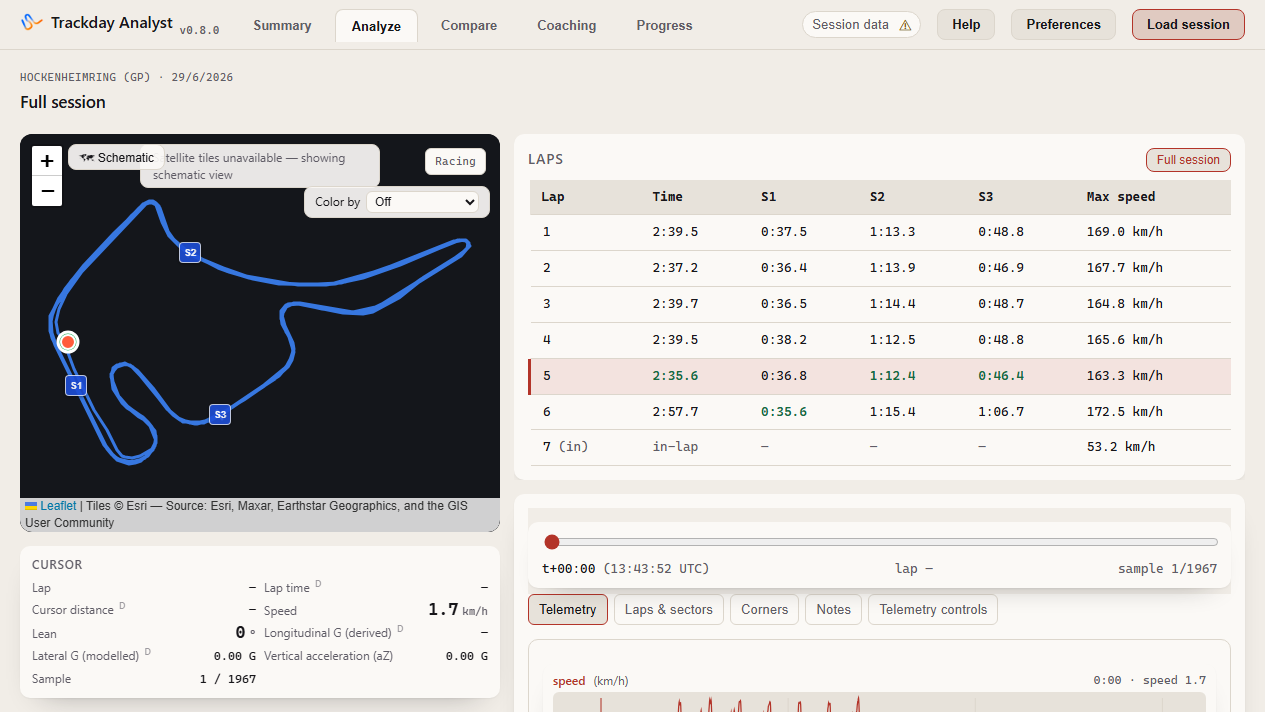
At desktop widths (1200px or wider), Analyze starts with a full-width map plate. Below it, the sticky left rail keeps lap/run selection and compact cursor details visible while the sheet workbench uses the normal page flow. There is only one page scrollbar.
Choose Telemetry, Laps & sectors (or Runs & sectors for road sessions), Corners, Notes, or Telemetry controls from the workbench strip. Corners is absent for road sessions; only one detail group is shown at a time and the strip wraps safely on phone-width screens. Coaching is not one of these tabs — it is its own workspace in the top bar.
Analyze overview: laps, map, inspector, and notes on the left; telemetry controls, time slider, charts, and insights on the right.
Laps and sectors
Click a lap to restrict the map, cursor, and charts to it. The table stays in the main Analyze flow on desktop, so it never forces a second map-column scrollbar. Best lap and best sector values are highlighted; the unfinished in-lap stays visibly separate. Pannónia-Ring can derive lap boundaries from its reviewed start/finish when Diablo left every lap marker empty; no sectors are invented.
Map (Left Pane)
The map appears before the lap/run selector. With a complete lap selected, a Corners button shows or hides the numbered corner-apex markers (off by default). Use Color by → Lean (φ) for blue left lean, silver upright running, and orange right lean; other channels retain their own ranges. The map automatically re-frames when containers resize.
Data quality
Analyze stays clear of outage banners. Sampling thresholds, genuine outages, classifications, and gap details live in Session data. When acceleration is derived from lean and GPS, the compact ! opens and focuses its full limitations explanation there. The Session-data tab triangle still summarizes device or position limitations.
Corners
With a complete circuit lap selected, open the collapsed Corners section to see the same entry, minimum, exit, lean, and roll-rate readings used in Compare. Choosing a row moves the shared map cursor to that apex. On RaceBox CSV sessions, the small gyro label beside Max roll means that value is measured by the gyroscope and Kalman-fused; sessions without that label keep the existing lean-derived calculation.
Cursor inspector (Left Pane)
Reads the current cursor. Derived longitudinal/lateral G say (derived) and carry D; vertical aZ remains a labelled recorded channel. Use raw accelerometer switches the inspector, strips, controls and G-G diagram together.
Notes
A collapsed-by-default section in the main Analyze flow. Click Add note, then click a spot on the map to drop a short text note there. Notes appear as pins; click one (on the map or in the list) to edit or delete it. Saved on your device only, and they resurface when you reload or load a different export of the same circuit.
Telemetry controls (Right Pane)
Controls & slider: the slider remains immediately available. Telemetry controls start collapsed at every screen width; open them to change channels, X-axis, or zoom.
Channels: independently show or hide Speed, Lean, Long. Acc. (aX), Lat. Acc. (aY), and Vert. Acc. (aZ). The compact controls wrap inside the pane when Focus map is active.
X-axis: switch between session time, lap time, and lap distance. Lap-relative modes require a selected or current lap.
Slider readout: follows that choice with session time + UTC, lap time, or lap distance.
Zoom: use 1×, 2×, or 4× to focus the charts around the shared cursor without changing the source data, while the timeline slider continues to span the full active range.
Pointer: hover a strip for a temporary preview; click or drag to pin the shared cursor.
Keyboard: Left/Right steps through recorded samples. Space starts or pauses simple sample-by-sample playback.
Sampling gaps: lines break across gaps longer than a threshold worked out from this session's own sampling rate (shown in Session data), not a fixed number of seconds, rather than drawing a misleading bridge.
Insights (Right-Pane Collapsible Sections)
Under the telemetry strips, the secondary panels are grouped into collapsible sections to keep the view clean. Toggle states are preserved during view navigation:
Lap consistency (expanded by default) compares complete laps scaled as time lost to the best complete lap, with absolute time and +difference together. The best lap is green and labelled Fastest; the hatched in-lap is excluded from the scale. Selection is shared with the table.
Theoretical ideal lap (collapsed by default) combines the best recorded sector from each complete lap and shows each sector's owner and the potential gain over the best real lap. For sessions missing recorded sector splits (like RaceBox CSVs or Diablo files where the layout wasn't configured), these splits are derived dynamically by detecting when your trajectory crosses the gate coordinates defined in the circuit database.
G-G diagram (collapsed by default) plots longitudinal versus lateral acceleration in a responsive canvas capped at 420 px, with circles and axes visible in Dark and Light. It highlights the shared-cursor sample and includes stats plus Colour by. When lean+GPS-derived acceleration is active, a compact ! opens the single full limitations explanation in Session data → Telemetry quality.
Multi-lap overlay (collapsed by default) lets you tick any combination of your session's complete laps to overlay their speed traces on one shared distance axis, each lap in its own colour with a shared hover readout — not limited to two laps like Compare.
Compare laps or sessions
Select two complete laps to compare side-by-side using the balanced Lap A and Lap B card pickers. Click Change on either card to open an inline lap list showing each lap's duration, maximum lean angle, and consistency chart. When you switch from the Analyze tab, your active Analyze lap is pre-selected as Lap A. When no Analyze lap is active and no selection is persisted, the app pre-selects your best lap as Lap A and second-best lap as Lap B (or the two longest same-direction runs in road mode). Cross-session loading is folded cleanly inside the Lap B card. Your selection is remembered across reloads for the same session.
Debrief presents the best lap/run, ideal gap, consistency, and prioritized evidence coaching cards. The first is the focus; each keeps its supporting values expandable and offers an honest next-session experiment.
At desktop widths (1200px or wider), the Compare view is split into two panes: the left pane is sticky and displays the track map (auto-fitting layout size), ghost replay controls, the live A/B comparison readout panel (ComparePanel showing current speed, lean, and delta time readouts), and the circuit match notice banner. The right pane houses the card pickers (with Session B controls inside the Lap B card), comparison summary card, coaching summary panel, and the Compare detail tabs (Telemetry, G-G diagram, Corners). Below 1200px, it stacks into a single column, map first. Switching tabs preserves the pair and replay position. Road comparisons show Telemetry and G-G.
Lap A is always solid and Lap B dashed, so identity never depends on colour alone.
Choose Lap A and Lap B in the card pickers.
For a different day, load a GPX into Session B inside the Lap B card first, then choose its lap as B.
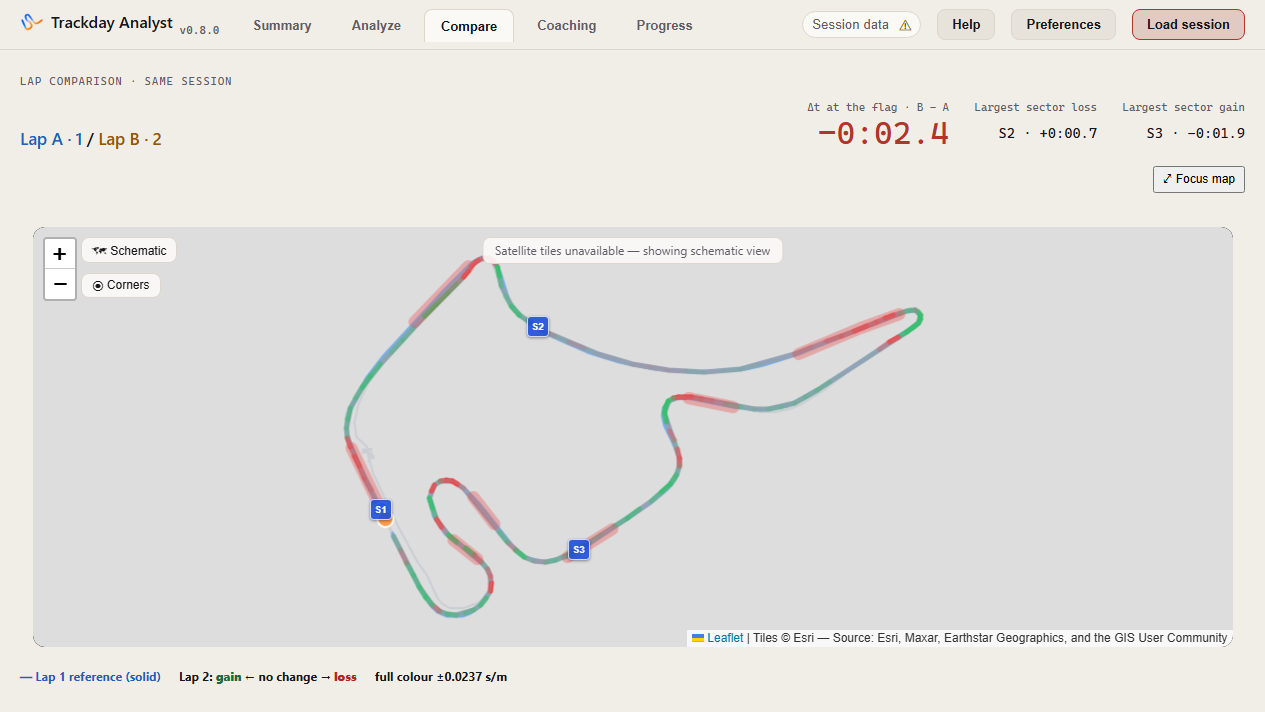
Read the signed difference as B − A: a negative result means B was faster.
Two-line map
See both recorded paths; a Corners button toggles numbered corner apexes (off by default, using official turn names like T1, T2 when matching a recognized circuit layout, or sequential numbers as fallback). The side panel follows the ghost position with speed, lean, and cumulative Δt.
Local Δt colour
Enabled by default to make B green where it gains and red where it loses (the dashed B identity remains underneath). Toggle off via checkbox if desired (remembered in preferences).
Ghost replay
Play, pause, reset, scrub, or choose 1×/2×/4×. Both colour-coded markers advance using recorded positions without floating labels obscuring the map.
Shared position and x-axis
Choose lap/run distance or elapsed time. Graph movement, slider/playback, map ghosts, and readouts share one nearest-recorded-sample position. Cumulative Δt appears only in distance mode.
Focused corners
The Corners tab starts with the selectable corner list. Selecting a row, a largest-local-change card, or Previous/Next updates the synchronized speed, lean, and cumulative Δt detail below; the map ghosts follow the same position.
Motorcycle coaching panel
Located in the Corners & coaching detail tab, this panel provides: (1) Neutral-motion cards that estimate the duration and share of qualifying leaned-over cornering time with near-zero derived longitudinal acceleration, plus comparison deltas; this is not a brake- or throttle-position measurement and has no universal better/worse verdict; and (2) a Corner Apex Diagnostics table displaying minimum speed, apex lean, and flick rate side-by-side. Click a corner apex row to snap the map cursor directly to that apex coordinate.
Lap summaries
Review total time, each sector, maximum speed, and the overall signed B − A result side by side.
G-G overlay
Both laps' longitudinal/lateral scatters share one circle — lap A as filled dots, lap B as open circles — with stats shown side by side. Reuses the same auto-detected fallback source (lean-derived lateral G vs GPS-derived longitudinal G) when the accelerometer is untrustworthy, ensuring a meaningful G-G overlay on circuit sessions.
Largest local changes
Up to three neutral cards show where lap B gained or lost the most cumulative time and open that corner directly, without inferring a cause.
Theoretical Ideal Lap Opponent (Circuit sessions only)
For circuit sessions with at least two complete laps, you can select "⭐ Ideal lap (best sectors)" as Lap B. This puts the workspace in a dedicated ideal-lap comparison mode:
Dedicated Sector Table: The right pane replaces the speed overlays, G-G diagram, and corner analysis tabs with a clean sector-by-sector table comparing Lap A splits to the ideal splits, showing sector source laps and potential gain.
Overlay Suppression: Because the ideal lap is synthesized from disjointed sectors, faked continuous overlays (like the speed/lean graphs, map path overlays, ghost replay markers, or G-G overlays) are suppressed to maintain telemetry transparency. Only Lap A's real trace is highlighted on the map.
Road sessions and elevation runs
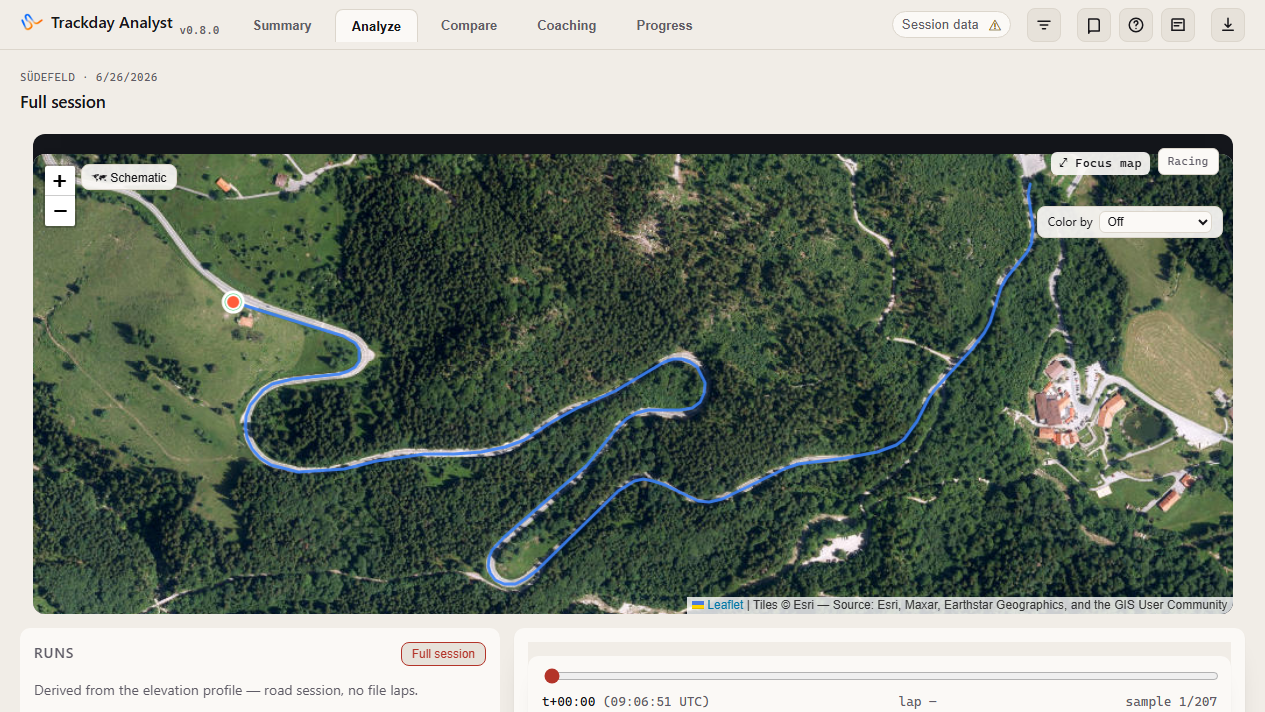
If a file has no complete circuit laps but contains a useful elevation profile, Trackday Analyst switches to road mode. It derives alternating uphill and downhill runs without changing the original elevation samples.
Road mode replaces the lap table with elevation-derived runs.
Select a run to focus the map, telemetry, and cursor on that section.
The table reports direction, duration, distance, elevation change, and maximum speed.
In Compare, choose two runs with the same direction and use distance or elapsed time. Cross-session selections must also clearly match the same physical road; ambiguous/different routes are explained and withheld.
An opposite-direction pairing is flagged instead of being presented as a meaningful comparison.
Reverse travel is recognized as the same physical road while keeping its direction-specific time separate.
Export your results
The Analyze workspace provides two local downloads via a compact toolbar row at the bottom of the Analyze right pane. Nothing is uploaded while either file is created.
Map snapshot (PNG)
Downloads a clean schematic track outline with the selected lap or run highlighted and the current cursor marked. Satellite imagery is not included because the Esri tiles cannot safely be read back into a client-side canvas.
Lap statistics (CSV)
Downloads derived lap number, complete/incomplete status, lap time, best-lap marker, sector splits and best-sector markers, and maximum speed. Missing values stay empty; road sessions have no lap CSV.
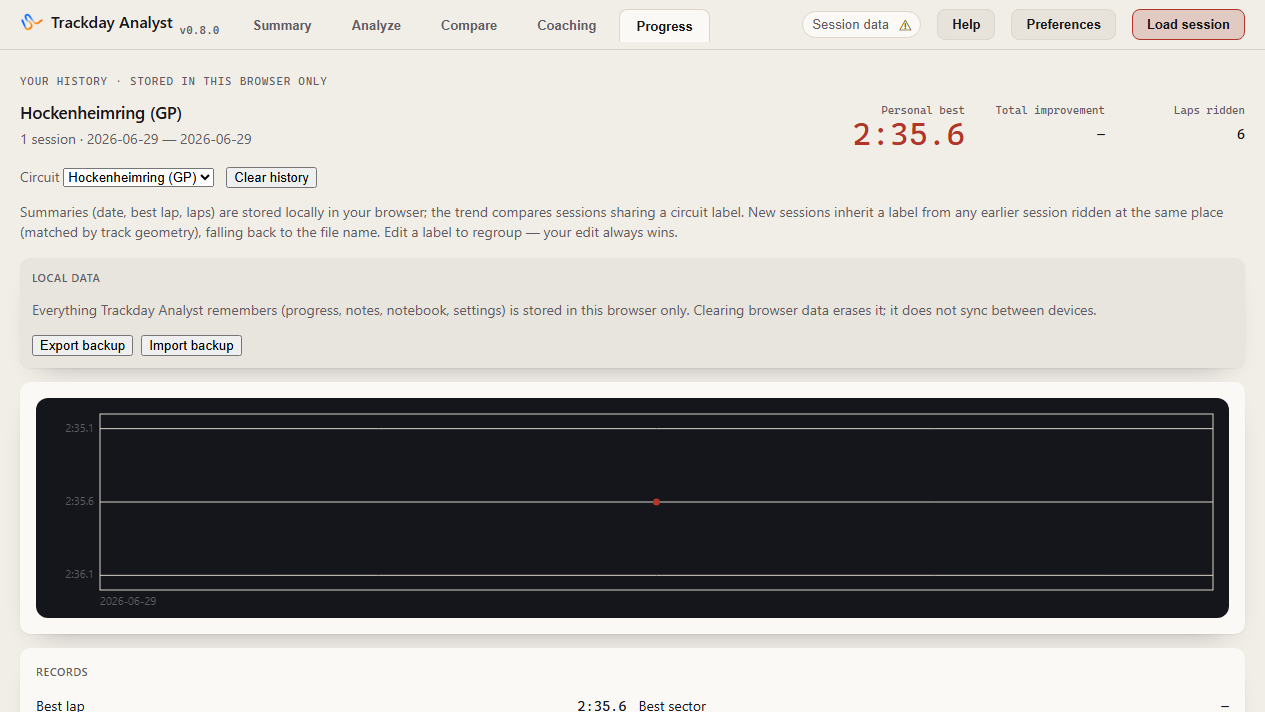
Progress opens with the locally stored personal best, improvement across the selected venue's history, and laps ridden. Records and the trend remain derived from browser-stored summaries; grouping stays label-based.
Track progress over time
Every loaded session contributes a small derived summary—date, best complete lap, lap count, and circuit label—to browser storage. Raw telemetry is never stored in the history.
The chart groups sessions by their editable circuit label and plots the best complete lap by date.
Choose a circuit label to display its trend.
Sessions are grouped by where you rode: when available, the app uses its recognized track identity (for example Hockenheimring (GP) or Pannónia-Ring); the file name is the fallback.
Edit a label to regroup a file if the automatic grouping was wrong—your typed label always wins and survives re-loading the file.
Remove one history row with its × button, or use Clear history to remove all stored summaries.
Road sessions stay outside the circuit-lap trend, but repeated matching traversals form Mountain-road records with separate uphill/downhill personal bests and a dated history. Recognized roads such as Südefeld use their proper name; reverse travel retains its direction-specific time.
Local data: backup and restore
Everything Trackday Analyst remembers—progress history, map notes, session notebook, preferences, and settings—is stored only in this browser. Clearing your browser's data erases it, and it never syncs between devices or browsers on its own.
The Local data panel (visible here even before you've loaded any session) lets you:
Export backup—downloads a single JSON file with everything the app has stored locally.
Import backup—restores from a previously exported JSON file, after confirming it's safe to overwrite matching data already in this browser. The page reloads afterward. An invalid or unrelated file is rejected with an error and changes nothing.
This is also how to move your data to a new device or browser: export from the old one, import into the new one.
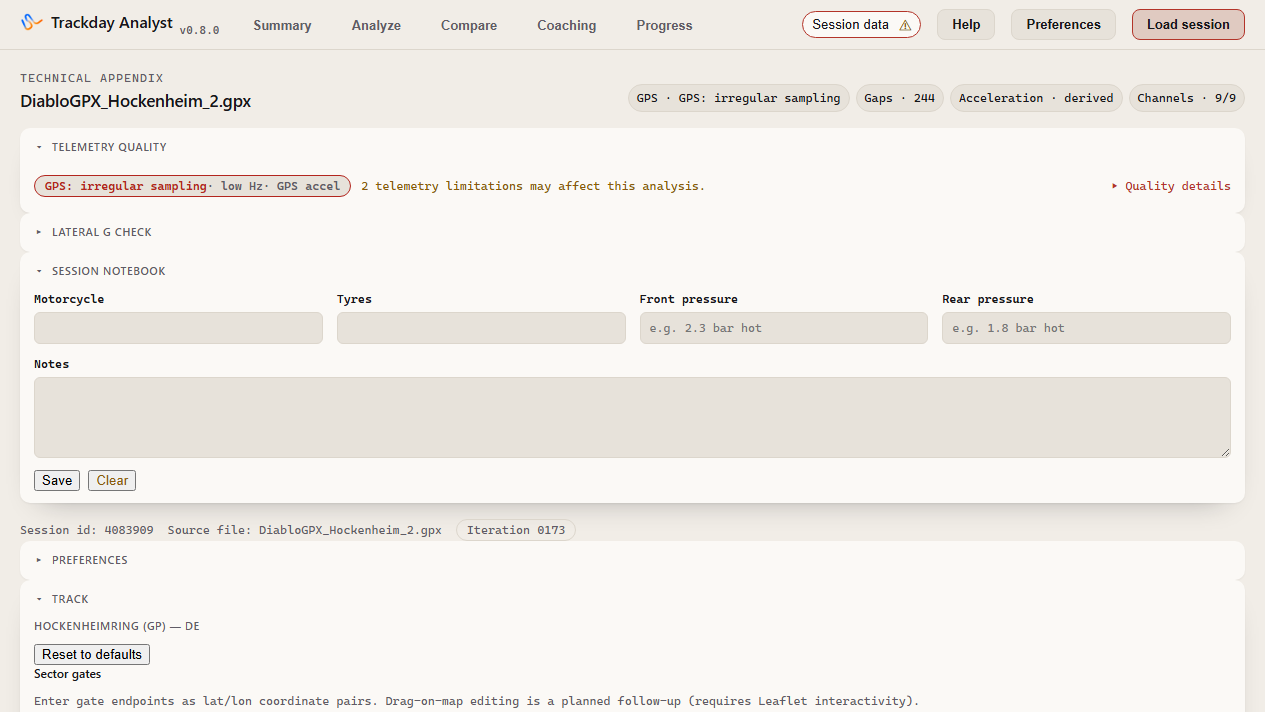
Session data is the compact technical appendix: header chips summarize quality, and the channel provenance table distinguishes source, derived, low-quality, and absent channels without guessing missing coverage.
The expanded Session notebook stores motorcycle, tyres, front/rear pressure text, and a note for the current recording. Save is explicit; Clear removes only that recording's entry. Bike and tyre names remain as recent suggestions for later sessions, while the compact header summary omits empty fields and the long note.
Inspect the source file
Session data separates facts about the GPX from the analytical views, making data quality visible rather than silently repairing it.
File metadata, summary counts, sampling intervals, bounds, field availability, and anomaly diagnostics live here.
Telemetry quality: owns the complete acceleration-source caveats. The compact ! from Analyze or Compare opens and focuses Derived acceleration limitations here.
Lateral G check: how closely the modelled lateral G agrees with the path your GPS recorded, as a ratio near 1.00, with the paired-sample count, trajectory coverage and the trajectory measurement's own noise. When the session has too few fast corners it says so and shows no figure. See How lateral G is worked out.
Sensor fusion: RaceBox sessions with a gyroscope show the Kalman-fused roll rate beside the lean-derived rate. The card makes the filter bias, resets, per-sample status, and its calibration limitations visible; choose a complete lap to focus the chart. Diablo sessions have no gyro and do not show this card.
Preferences: a collapsed section with the same Use raw accelerometer override available under Telemetry quality. It is the same saved preference, not a second setting.
Session facts: source filename, session id, trackpoints, duration, distance, lap count and provenance, maximum speed, and out-lap/parked samples.
Sampling: interval count, minimum/median/maximum interval, the gap threshold worked out from this session's own sampling rate, gaps over that threshold, duplicate timestamps, and negative intervals.
Source diagnostics: invalid timestamps or coordinates, non-monotonic distance, expected GPX fields that are absent or emitted-but-empty, and a detailed three-way telemetry gap classification breakdown (Genuine Outages, Stationary Stops, and Suspended Transit) with individual start times, durations, distances, and average speeds. Pannónia reports all 1,700 source lap numbers and sector labels as empty even while derived laps are available.
Track (circuit database): if the session is at a recognised circuit (Pannónia-Ring is the first bundled entry), the Track panel shows the circuit name and lets you edit sector gate positions (lat/lon coordinate pairs) and rename corners — all stored locally. Reset to defaults restores bundled values. For unrecognised tracks, Save as new circuit persists a custom entry locally so future sessions at the same location are recognised automatically.
How lateral G is worked out
Your device does not measure cornering load usefully, so where you see Lateral G (modelled) the app has worked it out rather than watched it happen. That is what "modelled" means, and it is why the word is on the label.
The calculation starts from your lean angle: a leaned-over motorcycle balances cornering force against gravity, so the angle tells you the load. It also allows for the fact that a real tyre has width — as the bike rolls, the contact patch moves toward the inside of the corner, shortening the lever the load acts on. A textbook calculation that assumes a knife-edge tyre reads about 10–25 % high.
The one thing it cannot see is you. The model works out where the bike is leaned, not where your body is. Hang off and you move the combined centre of mass inward, so the bike leans less for the same corner speed — and the figure reads low. No lean-based calculation can correct for this.
The Lateral G check, in Session data, shows whether the model is holding up on your session. The app separately measures cornering load from the path your GPS recorded and reports the ratio between the two. A value near 1.00 means the two agree. Consistently below 1.00 is the body-position effect above. The check needs enough fast corners to mean anything — it uses only samples above 0.3 g and needs at least a hundred of them, so a short or slow session will say it has not got enough to tell you.
Reading the results well
Start broad
Scan the whole session first, then select one lap or run and increase timeline zoom around an interesting braking or corner sequence.
Compare shape, not one number
A faster lap can lose in one corner and recover elsewhere. Use the Δt trace together with speed, lean, and the map.
Respect source quality
A gap, missing value, or implausible channel remains missing or visible. Check Session data before drawing a strong conclusion from a strange graph.
Know what is derived
Laps and sectors follow Diablo labels; ideal laps, distance alignment, runs, corners, braking points, deltas, and the coaching summary are calculations made by Trackday Analyst. Notes are the exception — your own typed text, stored as-is.
Deliberate limits
No cloud, account, backend, or automatic sharing.
No invented, smoothed, or corrected source telemetry.
Designed for Diablo Super Biker GPX exports and RaceBox CSV exports, not arbitrary GPX/CSV formats — other loggers, or RaceBox's own VBO/KML/GPX exports, are not supported.
The reviewed known-circuit catalogue currently contains Pannónia-Ring full clockwise only. Unknown circuits without source lap markers do not receive guessed laps.
Acceleration channels are named by the Diablo device's own convention (longitudinal aX, lateral aY, vertical aZ). The naming is the device's; the recorded longitudinal value is small and doesn't track braking, so it's a direction indicator only — braking analysis stays speed-based and no calibrated braking-G is claimed.
Motorcycle sessions that include a lean-angle channel (such as Diablo GPX or RaceBox CSV) default the G-G diagram to the derived (lean + GPS) friction circle. If a raw lateral channel is present, it can still be forced for inspection using Use raw accelerometer in Session data → Telemetry quality or Session data → Preferences.